
How To Detect Hazardous And Costly Bearing Faults in Industry
1. Introduction
Rolling element bearings play a pivotal role in the industrial landscape. Their malfunction can spell not just financial loss but also potential hazards. Predictive maintenance, enabled by sensor technology, can pinpoint issues in advance, allowing optimal utilization of bearing lifespan – ensuring cost savings and safety.
A prevalent challenge is that most predictive algorithms require extensive data on the asset. Such data is scarce for older machinery (often a decade or two old). Manual analysis by vibration experts, though effective, is time-consuming. Our solution uses the NEON vibration sensor paired with the SolidRed analytics platform. The combination enables swift, automated detection of bearing anomalies, regardless of prior asset knowledge.
This paper describes the automation of this process, overcoming the lack of historical data and the time-consuming nature of manual analysis.
2. Decoding Bearing Faults
2.1 Bearing Failure and Vibration Signatures
Bearing failure is a multifaceted issue that can appear in multiple dimensions. Bearings play a crucial role in many mechanical systems, and their health is vital for proper functioning and longevity.
2.1.1 Vibration in Healthy Bearings
In a pristine condition, bearings are not devoid of vibrations. They inherently produce vibration signals due to two primary reasons:
Radial Clearance: The free space between the inner and outer races allows for slight movement. This is an intentional feature in many bearing designs to accommodate thermal expansion and other operational parameters.
Contact Deformation of Rolling Elements: As the rolling elements travel through the load zone, they undergo slight deformations due to the forces exerted upon them. This change in shape, though minuscule, results in a unique vibration signature.
This deterministic, repetitive signal acts as the base or carrier wave upon which anomalies, due to failures, will later be superimposed. The visualization of these dynamics is aptly depicted in Figure 1.
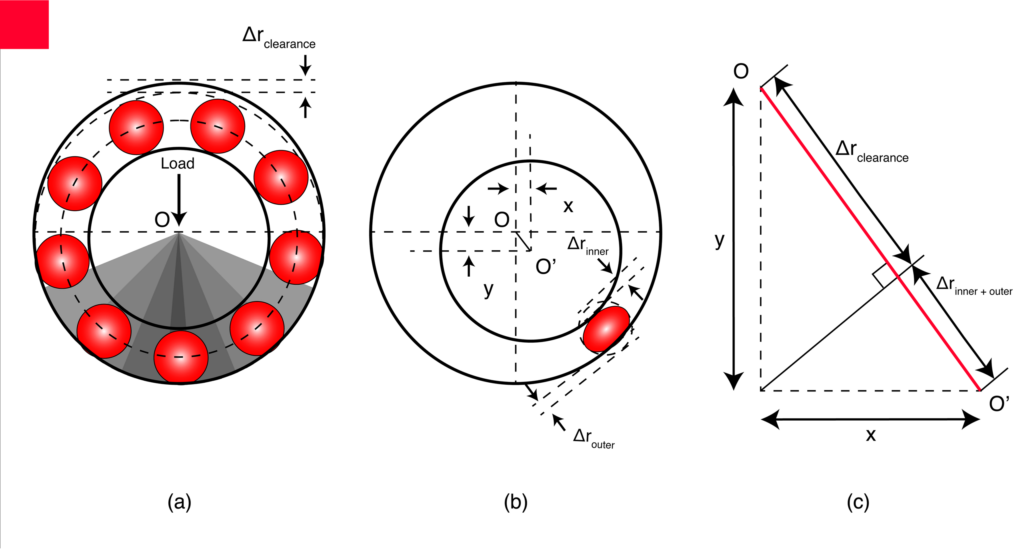
a) Deflection due to radial clearance. b) Deflection due to contact deformation of rolling elements. c) Geometric view of total deflection.
2.1.2 Defect Vibration Signatures
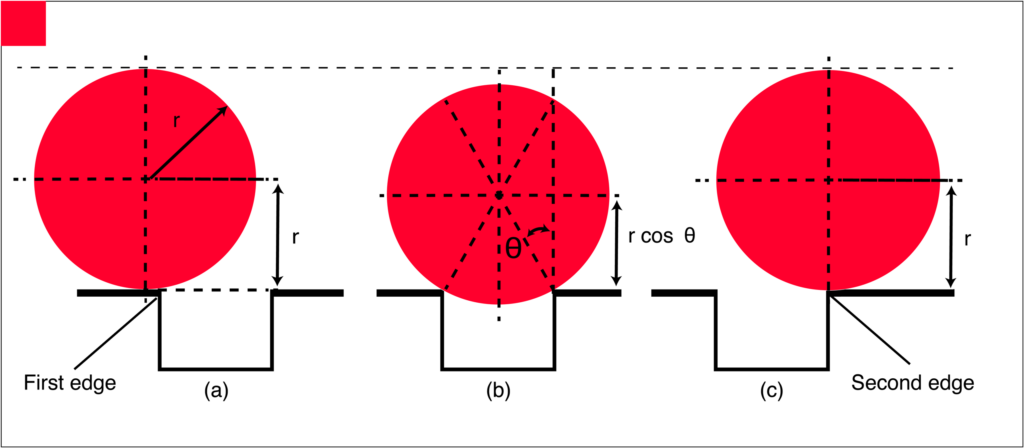
Certain anomalies in bearing operations, like pits, cracks, and spalls, generate distinct impulse response signals. These imperfections can emerge on any part of the bearing – the races, the rolling elements, or even the cage. When the rolling element interacts with these defects, a characteristic signature arises. This interaction is a multi-stage process:
Initial Contact with Defect: The rolling element first meets the defect’s edge.
Impact with the Second Edge: As the rolling element traverses the defect, the impact effectively reduces the diameter. This means its contact profile changes momentarily as it interacts with the defect’s depth.
Exiting the Defect Zone: Once past the defect, the rolling element’s effective diameter returns to its original form, signaling the end of the defect interaction.
These phases are captured in Figure 2.
The vibration signal generated due to the interaction with defects, especially the impact with the second edge, is of significant interest. This impulse not only alters the native vibration signature of the bearing but also resonates through the entire bearing assembly, echoing at its natural resonance frequency, which usually lies in the 4-6 kHz range. These impulse responses subtly modulate the amplitude of the bearing’s vibration signals. Moreover, if a bearing operates at a constant speed, these impulse responses will manifest at consistent intervals, leading to a persistent fault frequency distinct from the resonance frequency.
2.1.3 Progression of Bearing Fault
It’s worth noting that bearing faults aren’t static. Over operational time, the continuous interaction with a fault exacerbates its severity. As the defect grows, so does the energy of its vibration signature. If these warning signs are overlooked or left unattended, the defect can grow to a point where the bearing and the entire mechanical system can face catastrophic failure.
Maintaining a keen observation of these vibration signatures, understanding their cause, and implementing timely maintenance strategies can ensure the prolonged life of bearings and the machinery they support.
2.2 Identifying the Challenge in Traditional Vibration Analysis
Traditional vibration analysis uses Fourier analysis, which transforms the vibration signal into its frequency spectrum. An analysis is then carried out in the frequency domain. However, doing so would only show the modulating (resonance) frequency, not the fault frequency. To detect bearing faults, the frequency of repetition of the modulating signal, fault frequency, must be detected.
With a prior understanding of the machine generating the vibration, pinpointing the fault frequency becomes straightforward. Bearing irregularities give rise to distinct frequencies, influenced by the bearing’s design and the shaft’s rotational speed. Using this insight, merely matching observed frequencies to known characteristic ones suffices to ascertain the presence of a bearing malfunction.
However, this information is only sometimes available. To automatically detect bearing faults, specific frequencies should be confidently designatable as defect

frequencies. Automatic detection also means that no person should be involved in monitoring the asset when nothing is out of the ordinary. Additionally, the detection should not be limited to only one asset. Thousands of assets should be automatically monitorable at once.
3. Developing an Innovative Approach for Bearing Fault Detection
Our solution employs advanced analytical techniques to accurately identify bearing faults. The approach is distinctive in its ability to detect anomalies within the vibration signals, a key indicator of potential bearing issues.
3.1 Signal Component Analysis
The core of our solution lies in the sophisticated analysis of vibration signals. Each signal comprises various components, and our focus is on isolating the one indicative of a bearing fault. This precise identification is crucial for effective fault detection.
3.2 Utilizing Gradual Fault Development
One characteristic of bearing faults is their incremental development over time. This gradual progression results in a steady increase in the energy signature of the fault within the vibration profile. By monitoring these subtle energy escalations, our system proactively identifies potential bearing issues at their nascent stage.
3.3 Proactive Fault Identification Strategy
Our proactive approach is centered around continuous monitoring and analysis of the energy levels in each vibration profile. This method allows us to detect early signs of bearing faults, long before they evolve into serious mechanical failures. By implementing this strategy, we ensure a higher level of precision in predictive maintenance, averting costly machinery downtimes and ensuring operational
efficiency.
4. Integration of Advanced Diagnostic Tools
Our solution is distinguished by the seamless integration of our NEON vibration sensor with a comprehensive asset management system. This synergy employs advanced digital signal processing techniques, guaranteeing precise identification of bearing anomalies.
4.1 Measuring the Signal
Our NEON vibration sensor specializes in continuous monitoring, making it the optimal tool for tracking the energy contained in vibration profiles. As it continuously gauges the asset’s vibrations, the sensor performs preliminary analyses and transmits the results to our asset management platform via LoRaWAN.
4.2 Extracting the Envelope Spectrum
The extraction of the signal envelope is executed through the Hilbert Transform, a mathematical maneuver that produces an analytical counterpart when applied to a real signal. This analytical signal’s imaginary component is the original signal, only phase-shifted by 90 degrees. By determining the analytical signal’s absolute value, we can isolate the real signal’s envelope. Our approach employs Fourier analysis to determine the envelope spectrum, with all processes being autonomously performed by the NEON vibration sensor.
Would you like to continue reading the full paper? Then download the PDF to gain access to the entire document.
-
View / Download as PDF
Read the Use Case in Full